

for this, you need some mathematical skills to set the scale of your graph you will get it all just by carefully seeing the code . You can also use colour to make it more representable.
I will be giving all the examples and all the dimensions.
So I would request to analyse the code carefully.
If you have any problems while coding feel free to comment down your query below. Keep coding
ALL THE BEST!!
import turtle
# Function that draws the turtle
def drawBar(t, height, color):
# Get turtle t to draw one bar
# of height
# Start filling this shape
t.fillcolor(color)
t.begin_fill()
t.left(90)
t.forward(height)
t.write(str(height))
t.right(90)
t.forward(40)
t.right(90)
t.forward(height)
t.left(90)
# stop filling the shape
t.end_fill()
# Driver Code
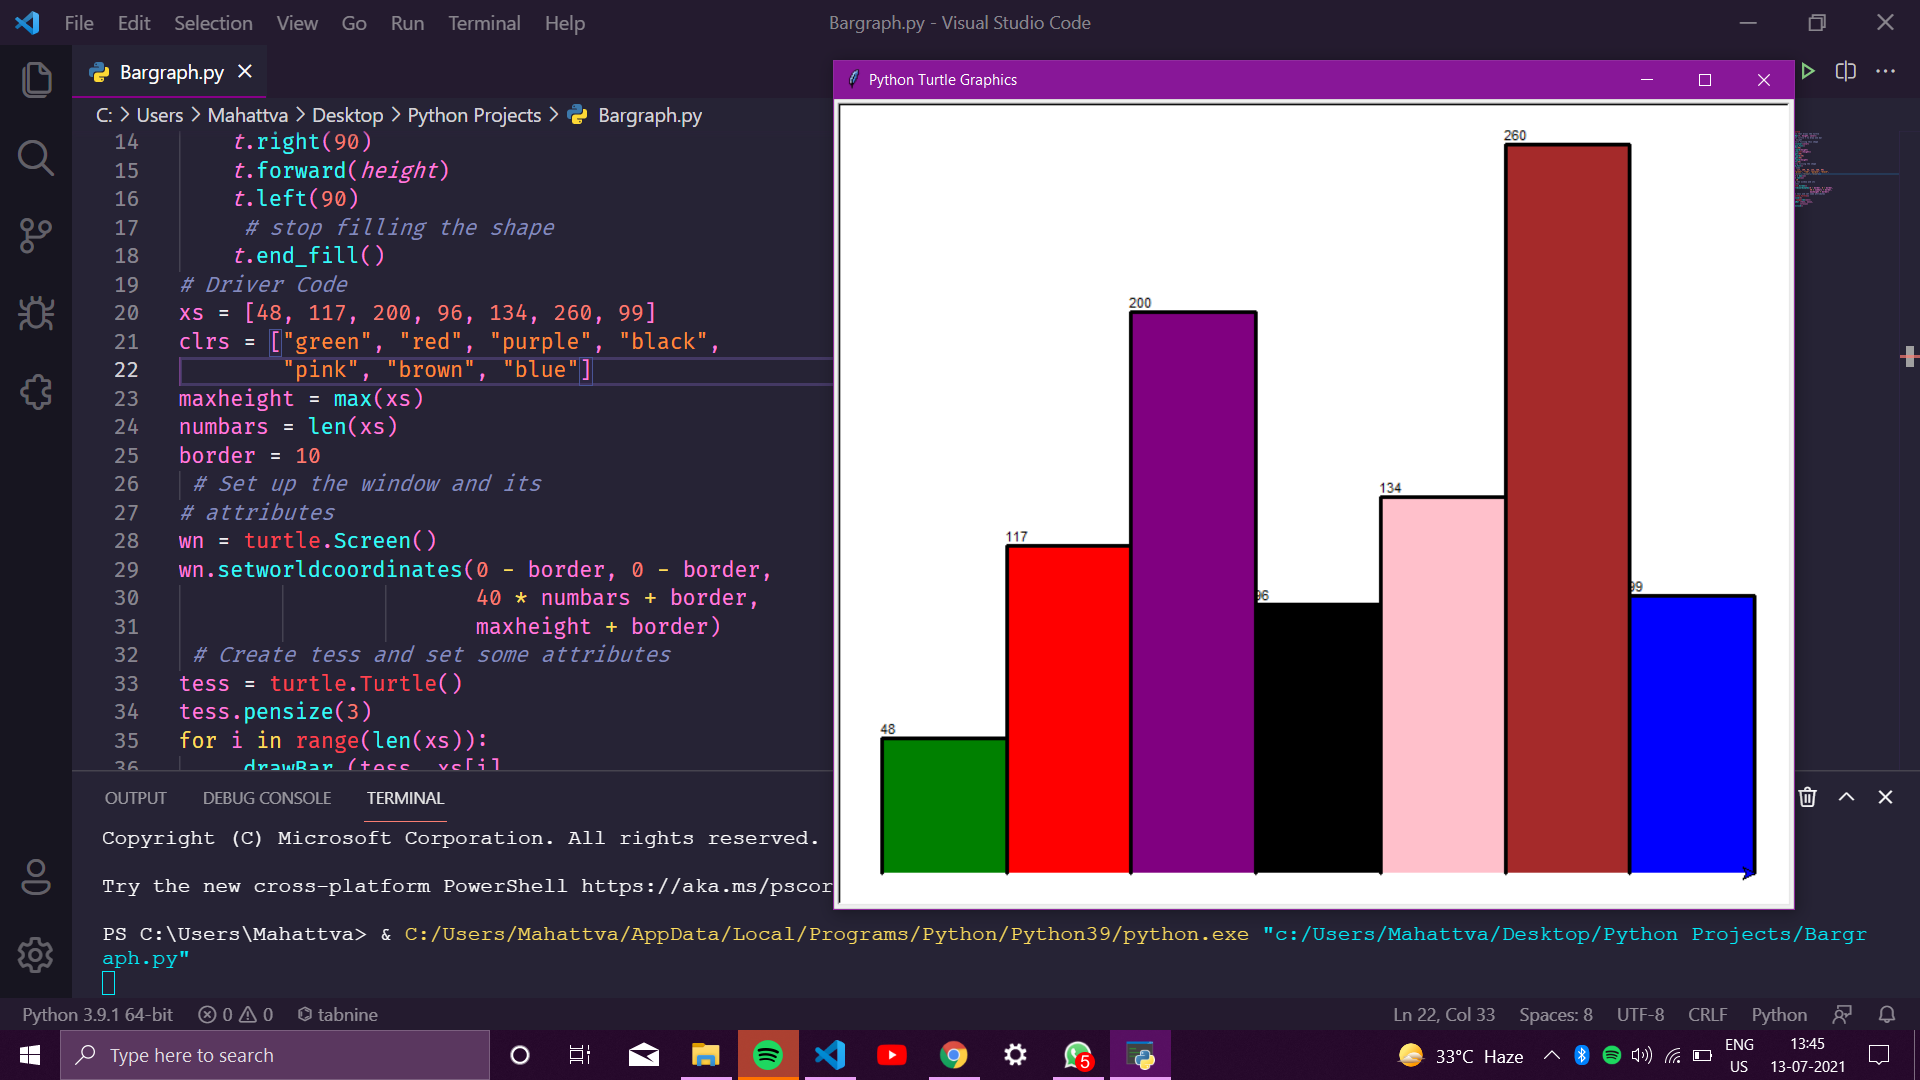
xs = [48, 117, 200, 96, 134, 260, 99]
clrs = ["green", "red", "purple", "black",
"pink", "brown", "blue"]
maxheight = max(xs)
numbars = len(xs)
border = 10
# Set up the window and its
# attributes
wn = turtle.Screen()
wn.setworldcoordinates(0 - border, 0 - border,
40 * numbars + border,
maxheight + border)
# Create tess and set some attributes
tess = turtle.Turtle()
tess.pensize(3)
for i in range(len(xs)):
drawBar (tess, xs[i],
clrs[i])
wn.exitonclick()


Brilliant 👍🏻
ReplyDeleteThanks For support!!
Delete